Minerals Hub / Geography & Supply Chains / When a route stays open and stops being usable
Geography & Supply Chains · · 4 min read
When a route stays open and stops being usable
Capacity is what a corridor carries when everything works; reliability is what it carries across a year — and the two most-watched canals spent 2024 demonstrating the difference in opposite ways.
Pending review
The short version
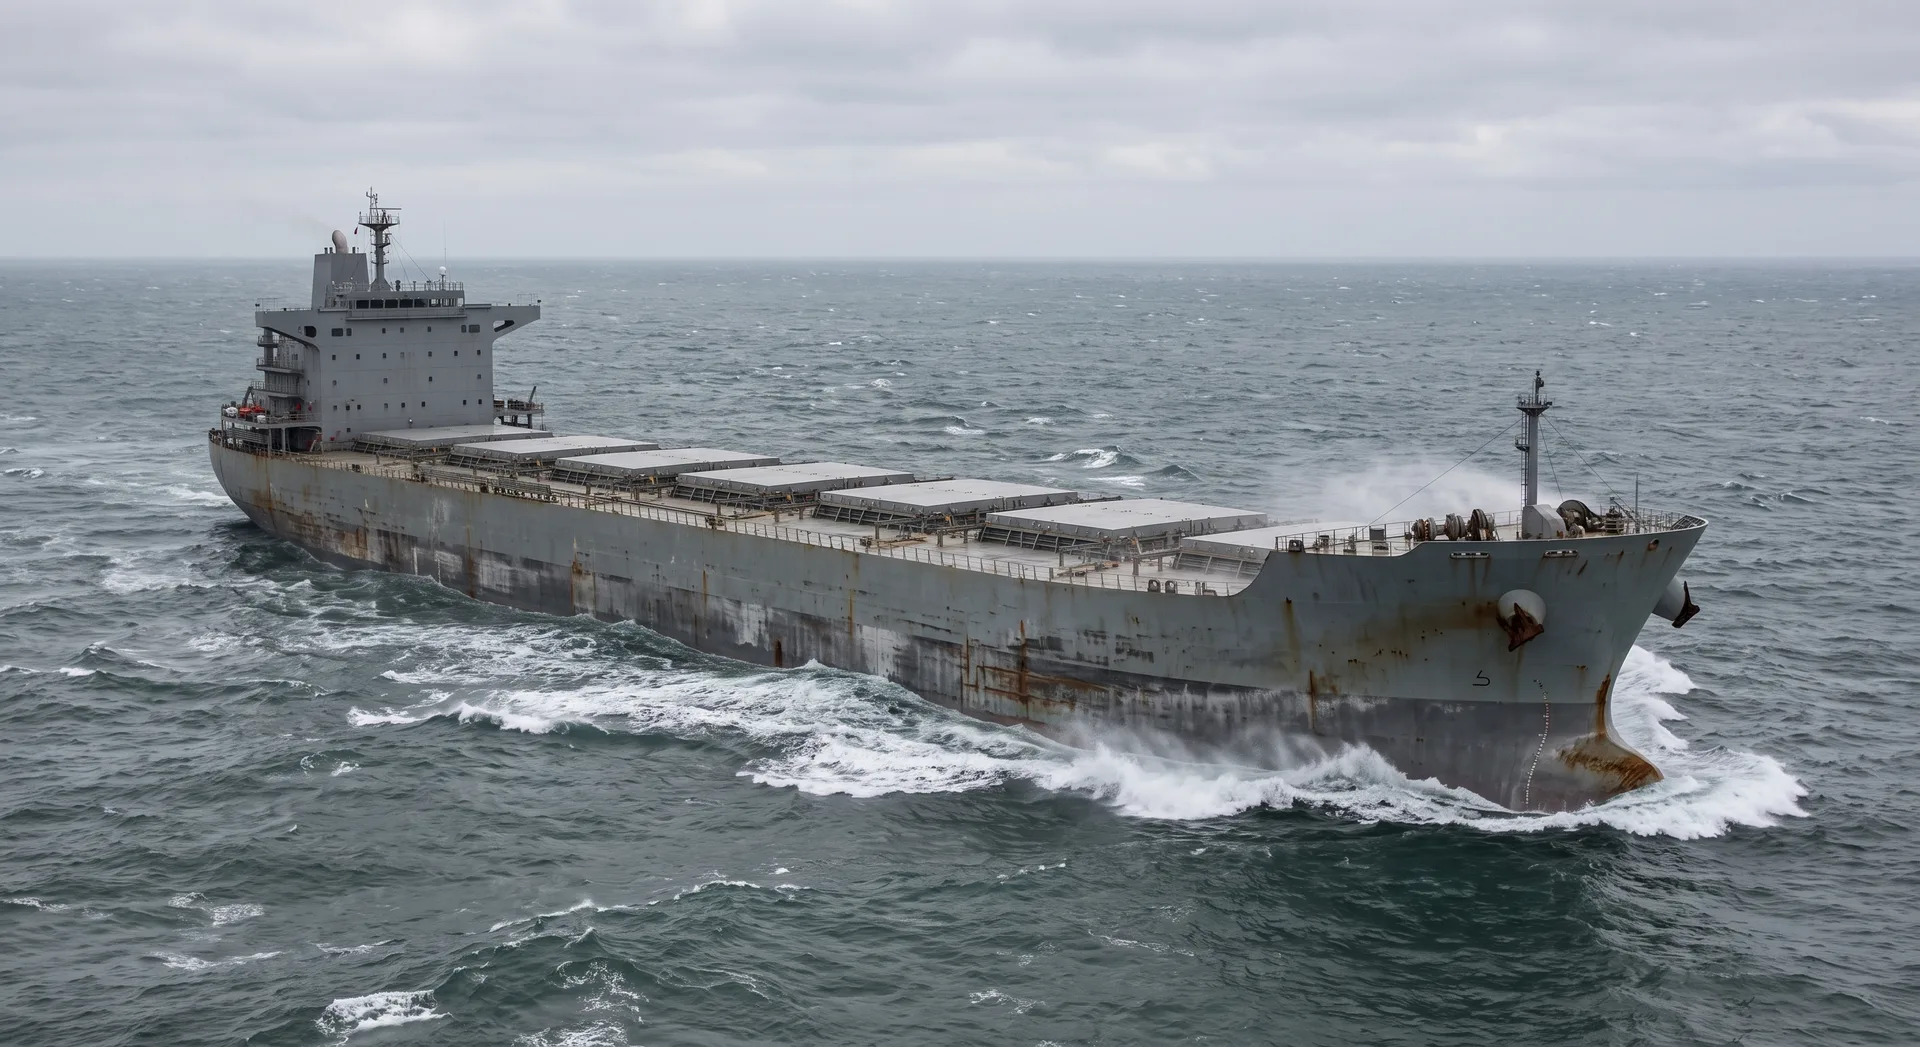
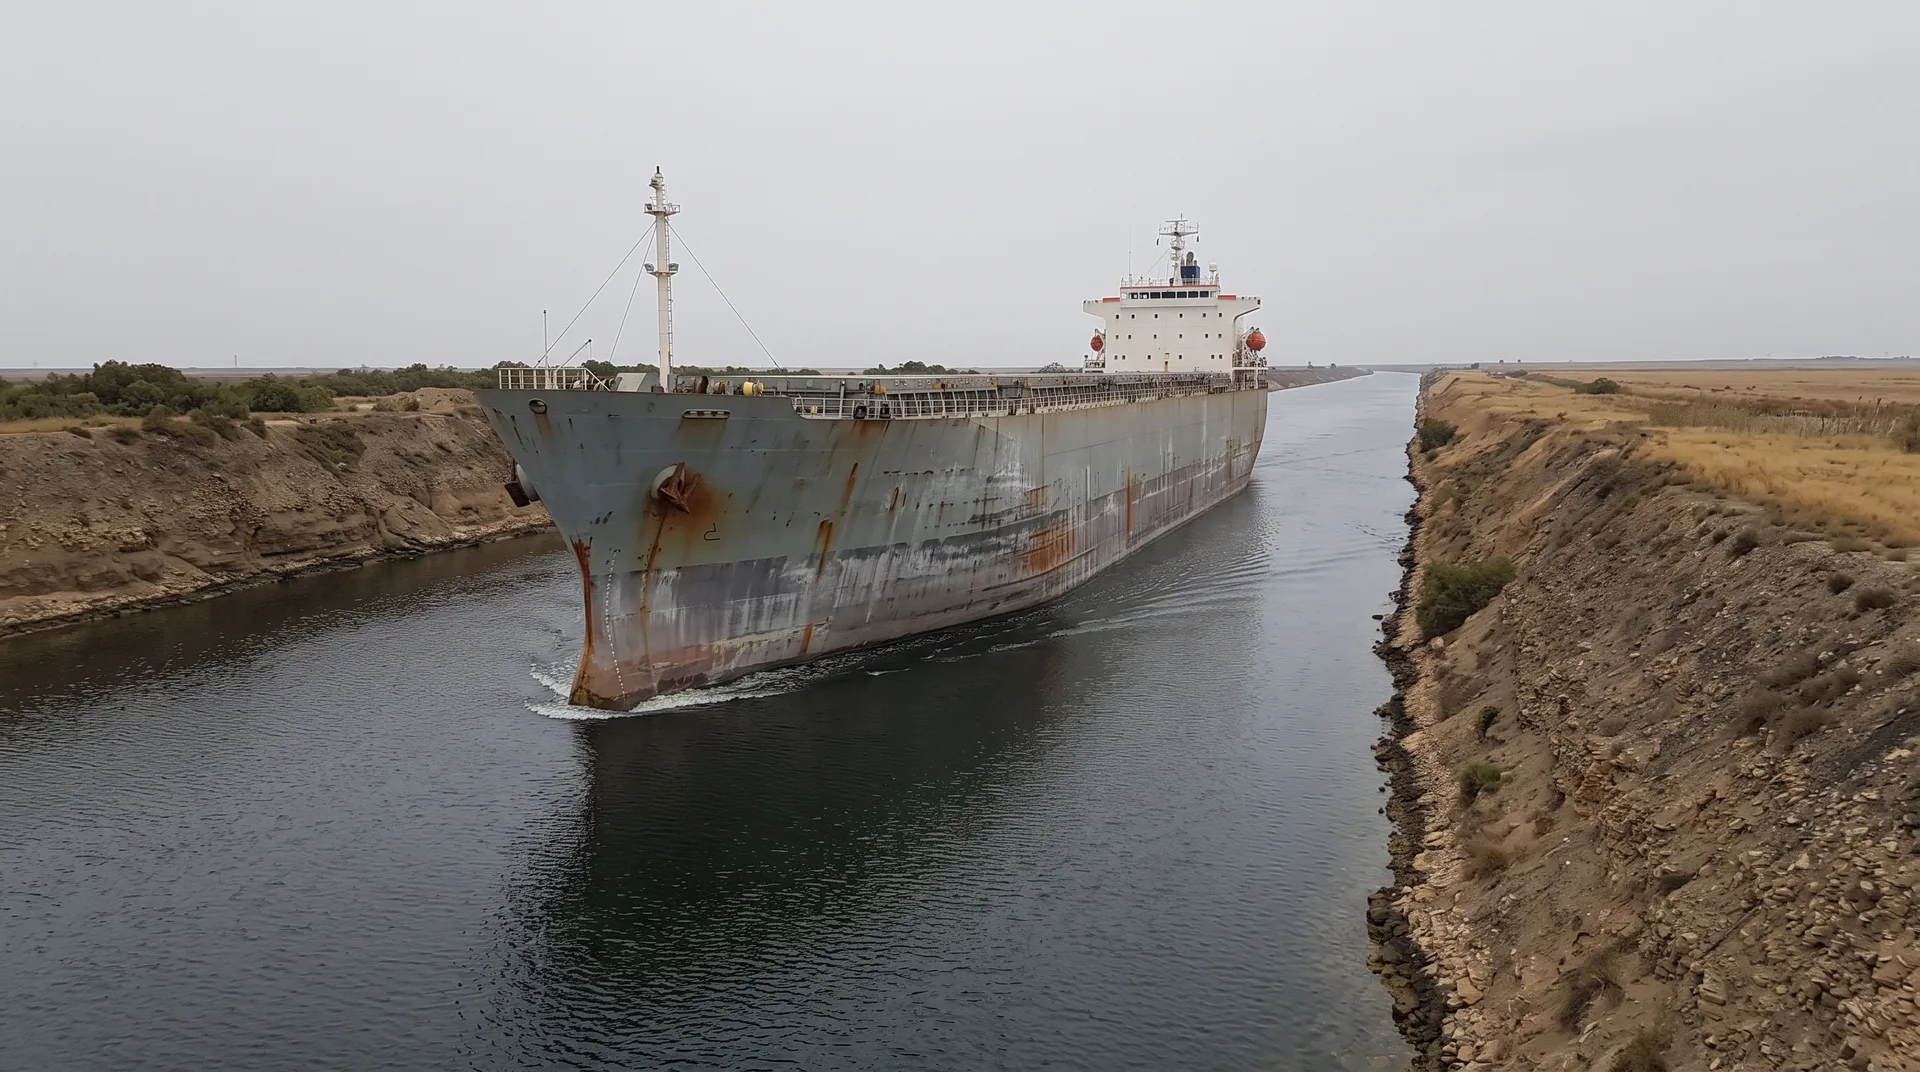
Neither the Suez Canal nor the Panama Canal closed in 2024. Both carried far less than they could, for reasons that had nothing to do with the width of the waterway — one because of what was happening at its approaches, the other because of how much rain had fallen upstream. The cost of a corridor that is open but avoided is paid in distance and days — and on the published figures the two have not come back at the same pace.
Two properties, routinely confused
A corridor's capacity is what it can move when everything works. Its reliability is what it actually moves across a year, including the weeks it does not work. These are different numbers, and a route can lose almost all of the second while keeping all of the first.
That is not a hypothetical. UNCTAD's assessment of 2024 records that, by June 2024, "the number of ship transits through the Panama Canal and the Suez Canal were down by over half compared to previous peaks (December 2021 and May 2023, respectively)". Nothing had been demolished. The locks and the cut were exactly as capable as before.
The Suez case: the ships chose not to go
At Suez the constraint was security in the approaches, and shipping responded by going somewhere else. By the autumn, UNCTAD reported that the mid-October 2024 average of 33 transits per day "was 57% below its previous peak, 55% lower than one year ago", and that rerouting vessel capacity around Africa's Cape of Good Hope "has surged by 89%".
What that substitution costs is measurable, because the alternative exists and is simply longer. UNCTAD sets out one representative leg, attributing the figures in-text to Coyne (2024): a ship travelling from Shenzhen to Rotterdam through the Suez Canal "travels 10,000 nautical miles in about 31 days", and by going around the Cape of Good Hope "the distance increases to 13,000 nautical miles and takes about 41 days" — both figures carrying the source's own about.
Ten days each way is not a shipping problem alone. The ITF's assessment of the episode puts the industrial consequence in one sentence: various manufacturing industries use just-in-time sourcing models, and "sudden increases in shipping times and shipping delays make just-in-time management unfeasible". That is as far as the sourced record here goes; what the added days cost in inventory or working capital is not something these sources quantify, and this article does not either.
A corridor that is open and avoided delivers exactly as much as one that is closed. The difference shows up only in how fast it can come back.
The Panama case: the constraint was upstream, and it lifted
At Panama the limiting factor was not what was happening at the entrance but how much water was in the lakes. That produces a different curve. UNCTAD's October 2024 note catches it mid-recovery: the four-week average of 30 transits per day "was 30% below the previous peak and only 4% lower than one year ago", and — the more telling half of the same sentence — it was already "40% above the lowest level of transits recorded in early 2024".
By 2026 the Canal Authority describes a corridor operating above its earlier norm, and attributes the position to the weather rather than to any engineering change: daily averages of "34 vessels in January and 37 in March, and peak days recently surpassing 40 transits", with unusually heavy rainfall during the dry season having "kept Gatún and Alhajuela Lakes at maximum levels".
Suez has moved more slowly. In February 2026 the Suez Canal Authority's chairman was reported as saying that 1,315 ships carrying a total net tonnage of 56 million tons "have transited the Suez Canal since the beginning of 2026", against 1,243 vessels and 47 million tons in the same period a year earlier — a recovery, on reported figures, but from a low base and on the order of one year against another rather than a return to the pre-disruption pattern.
What this changes about assessing a route
The comparison suggests a reading rather than proving one, and it is ours rather than any source's: a corridor limited by a physical input can recover when that input returns, and a corridor limited by risk recovers only when enough operators independently decide the risk has gone. Both were "open" throughout.
Which is why the question worth asking about an export route is not whether it is open but what would have to be true for a master to use it, and how quickly that condition can change. For a bulk mineral cargo the alternative is usually distance; for a specialised product going to one of very few receiving facilities, the alternative may not exist at all, and the same interruption lands very differently on the two.
Related
- Logistics — the handling and cargo rules that apply along these corridors
- Global Trade — the commercial terms and classifications attached to a shipment
- Export Controls — the legal conditions that can stop a movement outright
- Processing Centres — why so few destinations are available in the first place
- Supply Chain Risk — how route dependency is assessed before it is tested
Sources
- PRIMARYUNCTAD, Review of Maritime Transport 2024, Chapter II. Suez transit decline; the June 2024 statement that transits through both canals were down by over half; the Shenzhen–Rotterdam comparison, attributed in the report to Coyne (2024), of 10,000 nautical miles in about 31 days via Suez against 13,000 nautical miles in about 41 days via the Cape of Good Hope.
- PRIMARYUNCTAD news release, 'Suez and Panama Canal disruptions threaten global trade and development', 22 October 2024. Mid-October 2024 Suez average of 33 transits per day, 57% below its previous peak; Panama four-week average of 30 transits per day, 30% below the previous peak and 40% above the lowest level recorded in early 2024; rerouting around the Cape of Good Hope surging by 89%.
- PRIMARYInternational Transport Forum / OECD, 'The Red Sea Crisis: Impacts on global shipping'. Statement that sudden increases in shipping times and delays make just-in-time management unfeasible.
- PRIMARYPanama Canal Authority, 'Panama Canal Meets Rising Demand', 23 April 2026. Daily averages of 34 vessels in January and 37 in March, with peak days recently surpassing 40 transits; unusually heavy rainfall during the dry season keeping Gatún and Alhajuela Lakes at maximum levels.
- SECONDARYEgypt Today, 'Suez Canal Authority Chief: Over 1,300 ships transit canal', 9 February 2026 — reported remarks of Adm. Osama Rabie, Chairman of the Suez Canal Authority, giving 1,315 ships and 56 million tons net tonnage since the beginning of 2026 against 1,243 vessels and 47 million tons in the same period a year earlier. Reported speech in a news outlet, not a Suez Canal Authority publication.
- ANALYSISANALYSIS — the framing of capacity and reliability as separate properties, and the reading that a rainfall-limited corridor and a security-limited one recover on different clocks, are this publication's. Note what is NOT claimed: no source consulted here quantifies an inventory or working-capital cost of longer transits, and none of the figures below is specific to mineral cargoes.Non-public document · no public URL